9-2, Displaying Frequency (CCSS Mathematical Practices)
The number of times a data item occurs is the frequency of the item. You can display frequency in a line plot. A line plot displays data with x marks above each data value on a number line.

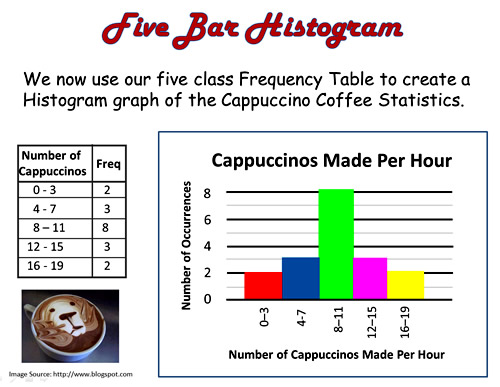
A frequency table lists the frequency of each item in a set of data. To display the data visually, make a histogram. A histogram is a special type of bar graph with no spaces between bars. The height of each bar shows the frequency of data within that interval. The intervals of a histogram are of equal size and do not overlap.
Frequency Tables, Line Plots, and Histograms (7:58)
